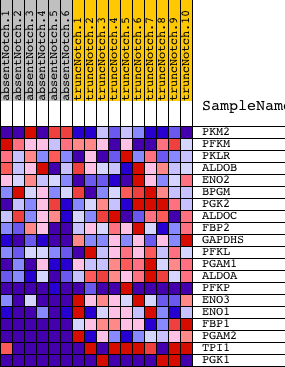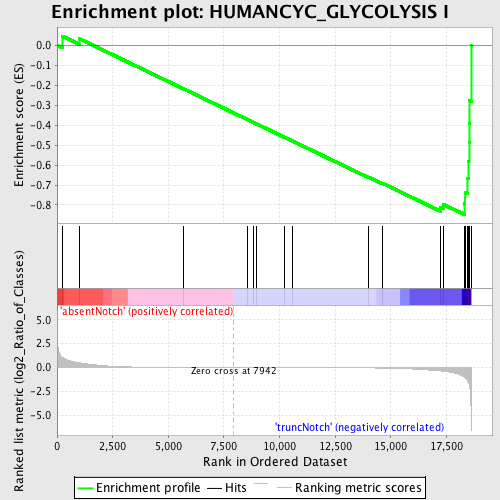
Profile of the Running ES Score & Positions of GeneSet Members on the Rank Ordered List
| Dataset | Set_03_absentNotch_versus_truncNotch.phenotype_absentNotch_versus_truncNotch.cls #absentNotch_versus_truncNotch.phenotype_absentNotch_versus_truncNotch.cls #absentNotch_versus_truncNotch_repos |
| Phenotype | phenotype_absentNotch_versus_truncNotch.cls#absentNotch_versus_truncNotch_repos |
| Upregulated in class | truncNotch |
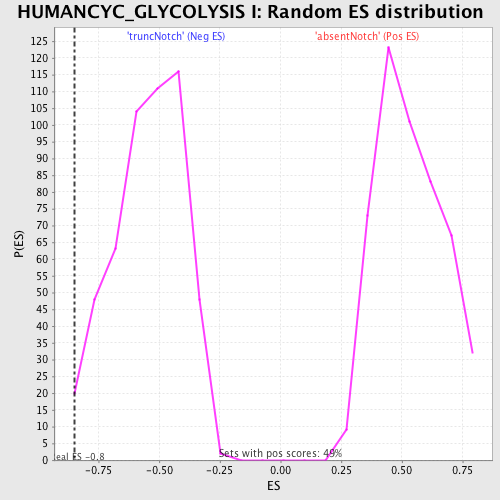
| GeneSet | HUMANCYC_GLYCOLYSIS I |
| Enrichment Score (ES) | -0.8478589 |
| Normalized Enrichment Score (NES) | -1.5591037 |
| Nominal p-value | 0.01171875 |
| FDR q-value | 0.3278723 |
| FWER p-Value | 0.914 |
| PROBE | DESCRIPTION (from dataset) | GENE SYMBOL | GENE_TITLE | RANK IN GENE LIST | RANK METRIC SCORE | RUNNING ES | CORE ENRICHMENT | |
|---|---|---|---|---|---|---|---|---|
| 1 | PKM2 | 6520403 70500 | 229 | 1.062 | 0.0472 | No | ||
| 2 | PFKM | 1990156 5720168 | 991 | 0.504 | 0.0345 | No | ||
| 3 | PKLR | 1170400 2470114 | 5677 | 0.007 | -0.2170 | No | ||
| 4 | ALDOB | 4730324 | 8552 | -0.001 | -0.3714 | No | ||
| 5 | ENO2 | 2320068 | 8815 | -0.002 | -0.3854 | No | ||
| 6 | BPGM | 5080520 | 8957 | -0.003 | -0.3928 | No | ||
| 7 | PGK2 | 2650091 | 10207 | -0.006 | -0.4597 | No | ||
| 8 | ALDOC | 450121 610427 | 10575 | -0.007 | -0.4790 | No | ||
| 9 | FBP2 | 1580193 | 13986 | -0.039 | -0.6602 | No | ||
| 10 | GAPDHS | 2690463 | 14608 | -0.056 | -0.6904 | No | ||
| 11 | PFKL | 6200167 | 17218 | -0.351 | -0.8110 | Yes | ||
| 12 | PGAM1 | 2570133 | 17350 | -0.383 | -0.7966 | Yes | ||
| 13 | ALDOA | 6290672 | 18304 | -0.964 | -0.7938 | Yes | ||
| 14 | PFKP | 70138 6760040 1170278 | 18334 | -1.022 | -0.7381 | Yes | ||
| 15 | ENO3 | 5270136 | 18458 | -1.372 | -0.6678 | Yes | ||
| 16 | ENO1 | 5340128 | 18494 | -1.566 | -0.5819 | Yes | ||
| 17 | FBP1 | 1470762 | 18514 | -1.688 | -0.4883 | Yes | ||
| 18 | PGAM2 | 3610605 | 18524 | -1.782 | -0.3889 | Yes | ||
| 19 | TPI1 | 1500215 2100154 | 18546 | -2.022 | -0.2767 | Yes | ||
| 20 | PGK1 | 1570494 630300 | 18610 | -5.004 | 0.0003 | Yes |